
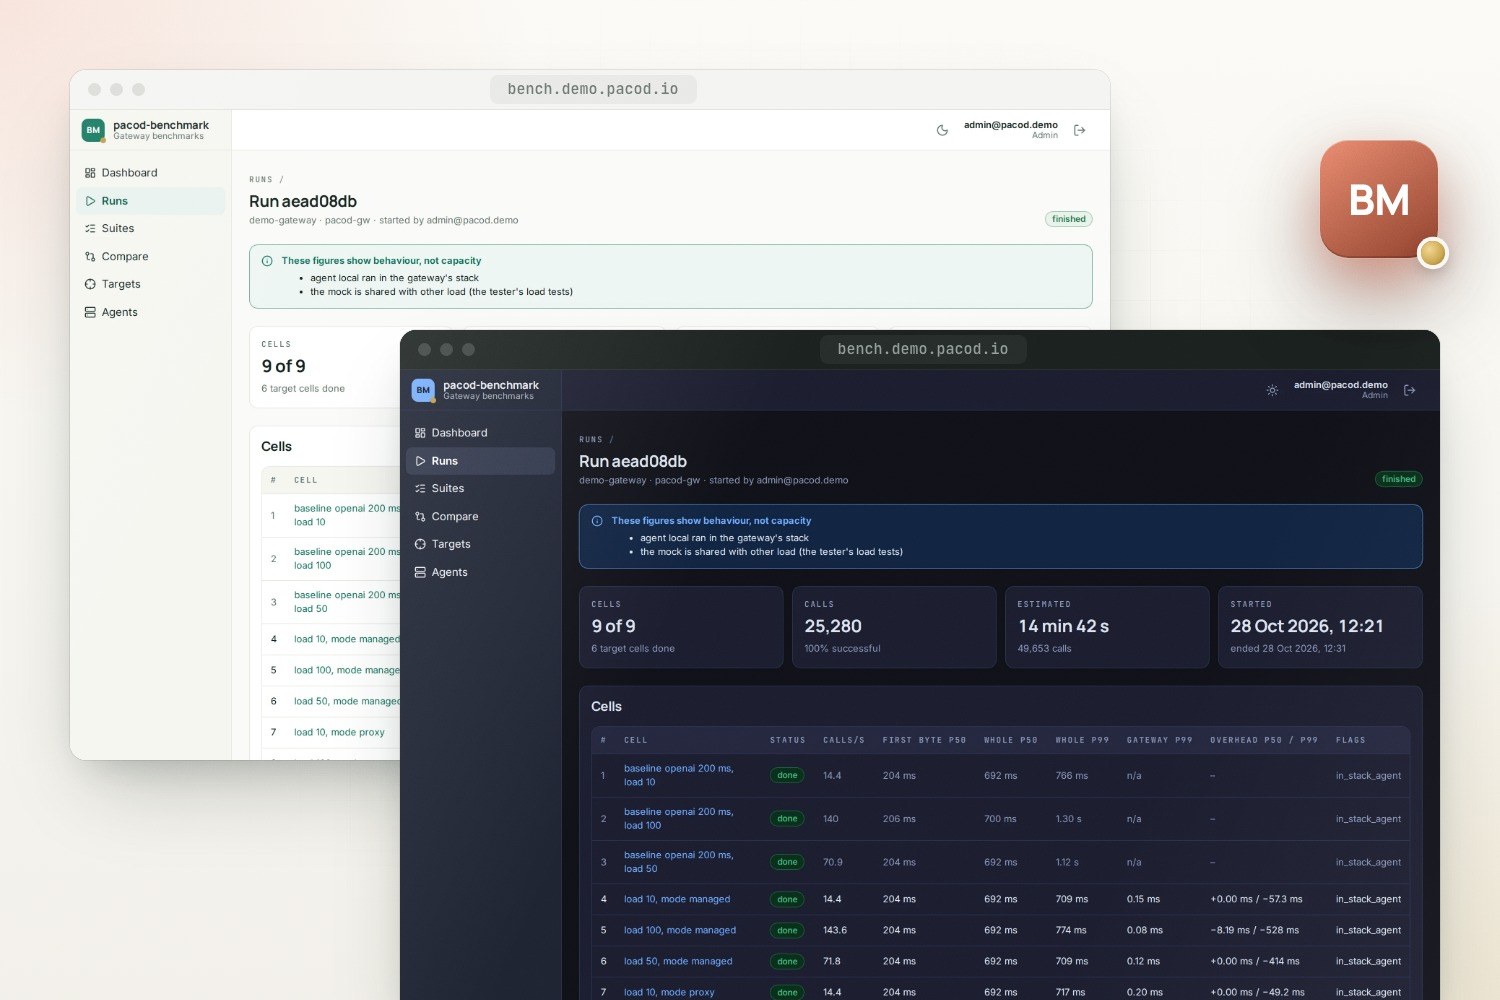
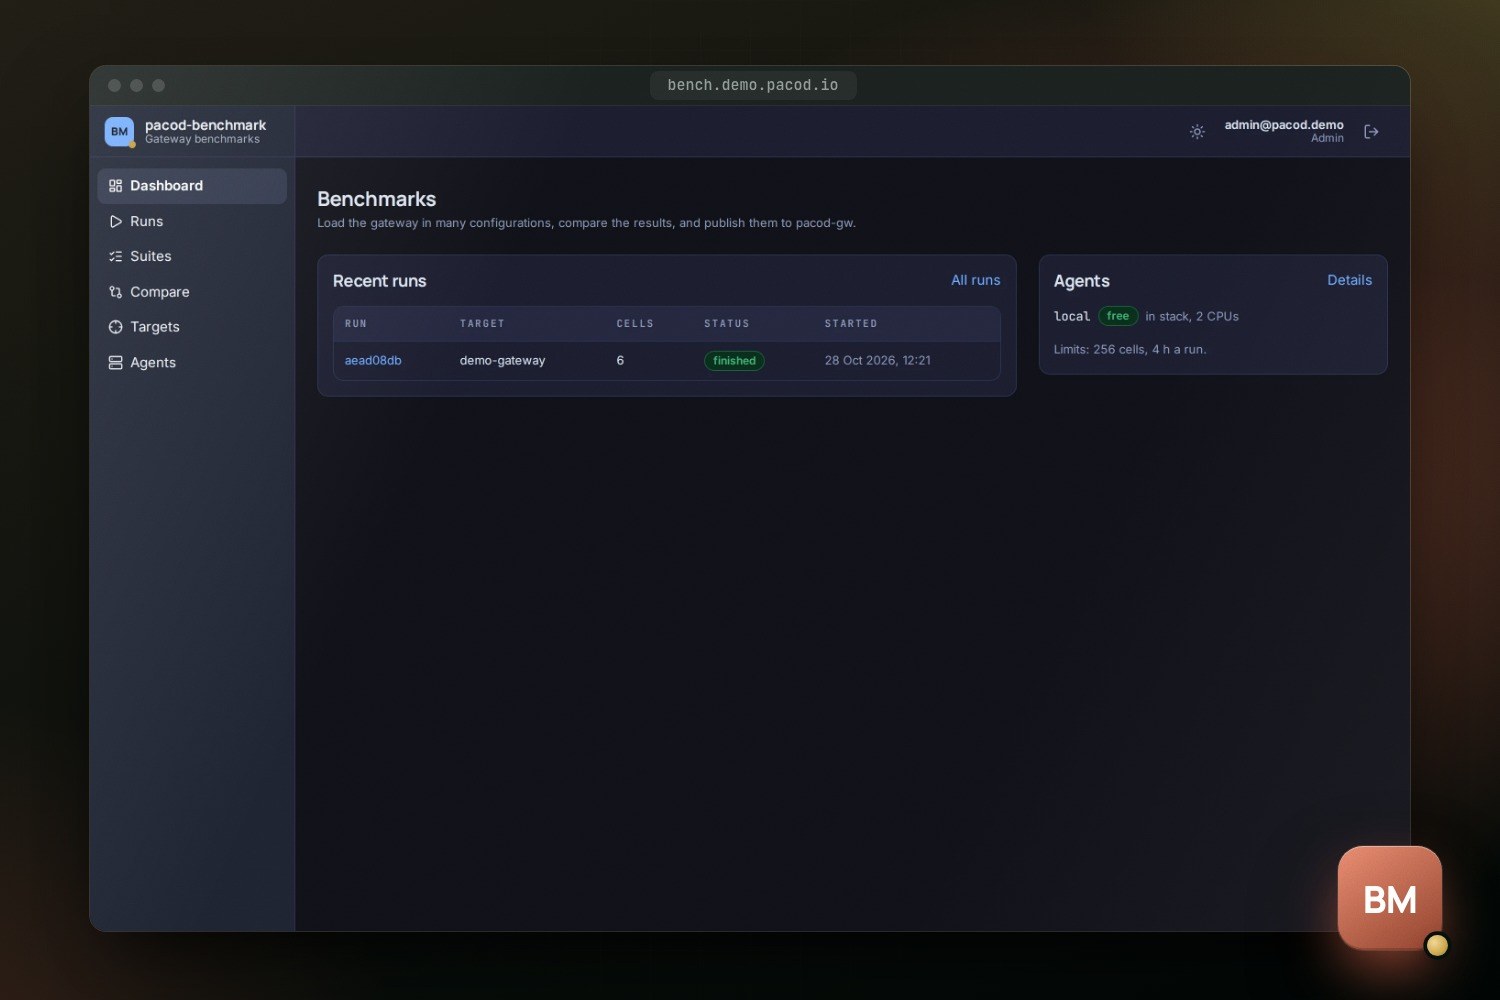
pacod-benchmark measures pacod-gw (its managed and proxy modes, the minimal gateway, its deployment layouts) and other gateways, in many configurations in one run. Every cell is measured against a baseline that calls the mock provider directly, so what is left is what the gateway added. Its UI writes the suites, follows the runs second by second and compares them; the reports go to the gateway's console.
Gateway benchmarks
- Licence: Apache-2.0
- Version: 0.1.0 · Preview
- Written in: Rust, TypeScript
- Tech stack: Rust, Axum, PostgreSQL, SvelteKit, Caddy, Docker, Prometheus
- View on GitHub · Open an issue
- Try the live demo
Features
Suites with axes
One base configuration and the fields it varies, named by dotted path. Every combination becomes a cell; those that cannot run are left out, with the reason.
A baseline for every cell
The same load from the same agents, straight to the mock. A cell's overhead is its latency minus its baseline's, including what the gateway's own timer leaves out.
A scene set up and taken down
On a managed pacod-gw, each run makes its own scratch organisation, workspaces, keys and mock providers, and removes them afterwards, keys first.
Any gateway as a target
pacod-gw-lite, another installation or another product as an external target, with a key pasted for each run and never stored.
Behaviour or capacity
Every run says which its figures show, and why — where the agents stood, whether they ran short of CPU, whether anything else shared the gateway or the mock.
Like with like
Runs are compared two to six at a time, and only cells that ran exactly the same configuration share a row, whatever the target.
Reports in the gateway's contract
A run's report is in pacod-gw's own format and passes pacod-gw's own checks. Publish it to the console, or download it and upload it there.
A queue and schedules
One run at a time, the rest in a queue you can reorder. Schedules start a suite daily or every few hours and can publish its report when it ends.
A command line
pacod-bench run runs a suite on a target from a terminal, without a database, a sign-in or the UI, and writes the report to a file.
Screenshots
Why a benchmark
A gateway is judged by two things: what it adds to every call, and how it behaves when many calls arrive at once. Neither shows in a single load test with a single setting. Most of a call's time is the provider's; the gateway's share is a small part of it, and it changes with the mode, the dialect, the cache, audit mode, the load and the deployment. pacod-benchmark measures that share across all of them in one run, and every result says whether it can be taken for the gateway's capacity or only for how it behaves.
It makes no load of its own. The calls come from pacod-gw's load agents, the same ones the console's tester uses for its load tests, and the reports are in a format pacod-gw defines and checks. The benchmark plans, sets up, starts the agents together, adds up their seconds and says what the figures can be taken for.
How it is built
browser ──► pacod-caddy ──► bench-ui (SvelteKit, signs in through pacod-id)
                                │ server side only, with the person's token
                                ▼
                        bench-api (pacod-bench serve) ──► PostgreSQL "bench"
                          │  admin token    ──► pacod-gw management API (scene, live figures, reports)
                          │  agent token    ──► pacod-gw load agents ──► the gateway, or an external URL
                          │                                        └─► the mock, straight (baselines)
                          └  service client ──► pacod-id (roles, feed, keys)
pacod-bench run (command line): the same controller, no database, no UI, a report file
- The controller is a library,
pacod-bench-engine, with no database and no server. The service and the command line run the same code. - The service,
pacod-bench serve, holds the API, the run queue, the scheduler and the PostgreSQL databasebench. It listens on the internal networkpacod-admin-netalone: only the UI's server calls it. - The UI is a SvelteKit front end that calls the API from its server, with the signed-in person's token. A run's page follows the run live, from a stream of server-sent events.
- The agents, the mock and the report's types are pacod-gw's, vendored at a pinned commit. A change to the agent's contract or the report's starts in pacod-gw and is vendored here.
A suite
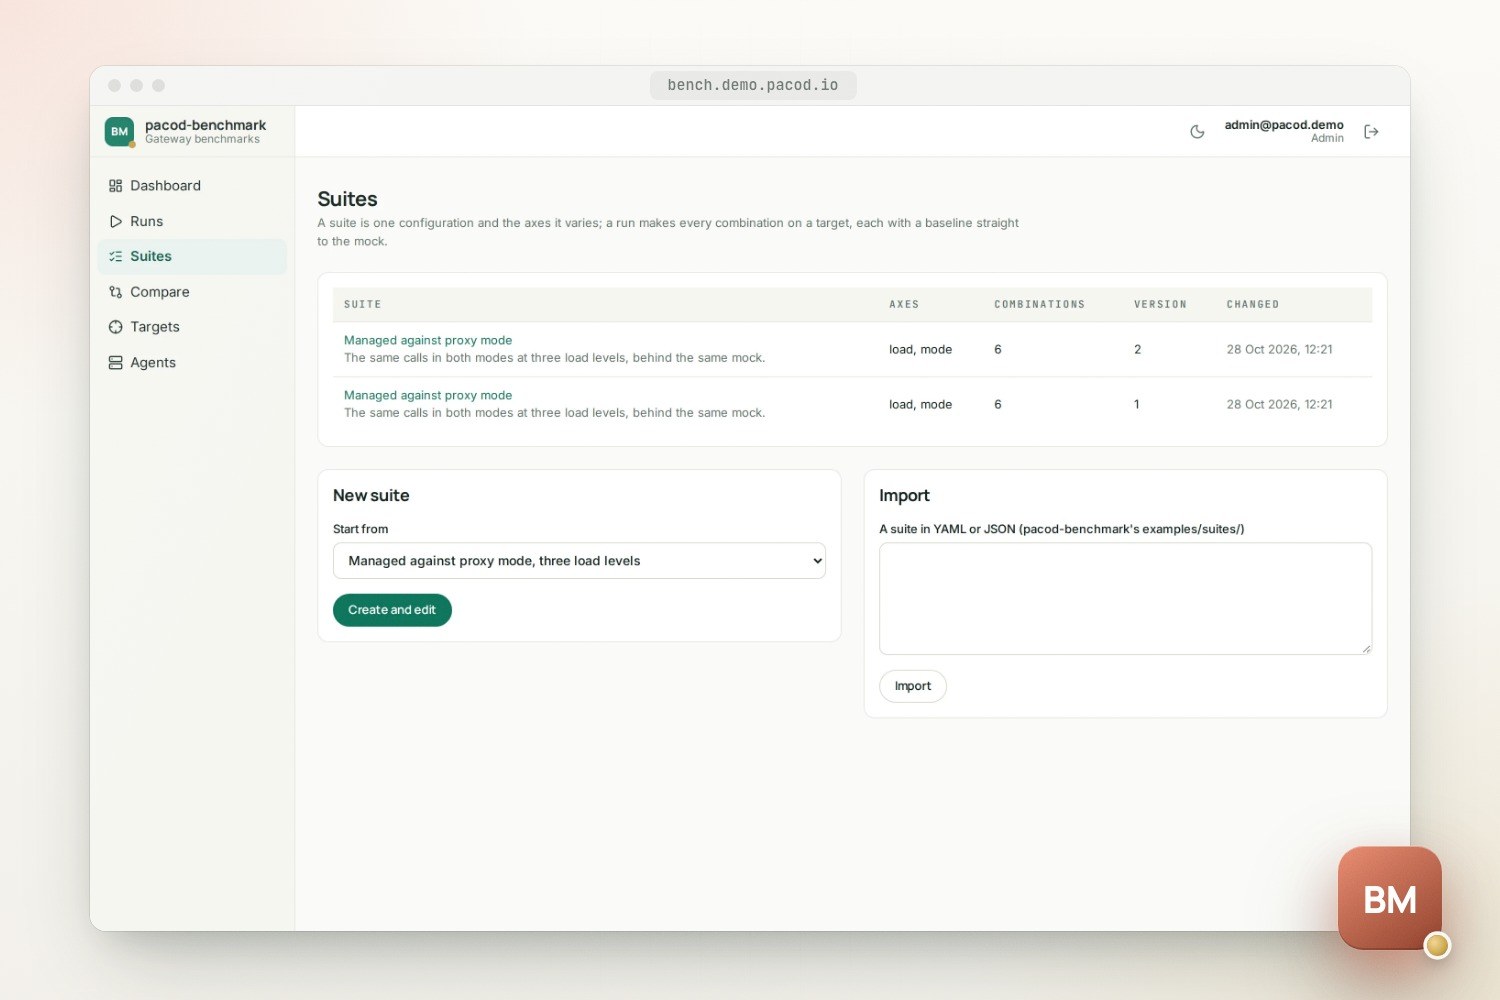
A suite is a base configuration and the axes it varies, in YAML or JSON. This is the example
examples/suites/modes.yaml:
name: Managed against proxy mode
description: The same calls in both modes at three load levels, behind the same mock.
base:
  request: { interface: openai, mode: managed, stream: true, prompt_words: 60, max_tokens: 64 }
  mock: { family: openai, delay_ms: 200, chunk_delay_ms: 20, chunks: 20 }
  workspace: { cache: "off", audit: on_request }
  load:
    mode: concurrency
    stages: [{ duration_s: 0, target: 10 }, { duration_s: 60, target: 10 }]
    timeout_s: 120
    warmup_s: 5
axes:
  request.mode: [managed, proxy]
  load.target: [10, 50, 100]
Two modes at three load levels make six cells, and the three load levels three baselines. What a cell's configuration holds:
| Part | Fields |
|---|---|
request |
The interface (OpenAI, Anthropic, Gemini, native, embeddings), managed or proxy mode, streamed or whole, prompt length, max_tokens, HTTP/1.1 or HTTP/2, further headers |
mock |
The dialect the gateway speaks upstream, and the mock's latency: before the head, between chunks, chunks per answer |
workspace |
The response cache (off, shadow, enforce), audit mode, the responses store, what happens when the usage spool is full |
key |
Inspection (full, or none for proxy mode's blind relay), the usage policy, a concurrency cap |
load |
A closed loop of callers (concurrency) or an open loop of arrivals (rate), its stages, the call timeout, a cap on calls, a warm-up left out of the figures |
An axis names a field by its dotted path; load.target scales every stage, so a ramp stays a ramp
at another peak. Combinations that cannot run are left out, and the plan says why: proxy mode
needs the mock of its own dialect, the native interface is managed only, the cache never answers
proxy mode or embeddings, and the same configuration twice is kept once. The grouped order keeps
together the cells that need the same gateway configuration, so the gateway reloads as rarely as
possible; shuffled spreads them in a fixed order, so that a slow drift of the machine does not
line up with one axis. Repetitions run each configuration again.
What only a deployment decides (analytics on or off, the cache store, the scale layout, the minimal gateway, the hardware) is no axis. Each such deployment is registered as a target of its own and given the same suite. The repository's examples cover the two modes, three provider latencies (20, 200 and 1,000 ms), the response cache, steps of calls a second, translation between dialects, and an external target. The full format is in docs/suite-format.md.
A run, step by step
- Plan. The suite is expanded for the target. An external target refuses the axes the
benchmark cannot set there (
mock,workspace,key). The run keeps its plan, with copies of the suite, the target and the agents. - Check the agents. Every agent must answer, speak this contract, be free and allow its share of each cell.
- Set the scene up on a managed gateway: read its fingerprint, create the benchmark's own
mock providers, a scratch organisation
bench-<run>, a workspace per variant with an explicit cache binding, and grant the mock models. Then wait until every gateway instance has applied the configuration. - Run each cell. Set the mock's profile if it changed and create the cell's key (its mode and model only, expiring 15 minutes after the cell's planned end), then wait for the instances again. Wait for the agents to be free, and watch the gateway's calls in flight for about three seconds (none are expected). Start every agent at once. Once a second, collect each agent's new seconds; every two seconds, the gateway's own figures. Then stop the agents, delete the key, summarise, and flag what a reader should know.
- Take the scene down, keys first, the rest newest first. What could not be deleted is listed as left over, for an admin to clean up. A cancel goes the same way, and if the API stops during a run, the agents stop on their own and the next start takes down what the run had made.
Baseline cells run first: the same request and load from the same agents to the mock directly, without any gateway. Their comparison key covers only what reaches the mock, so a managed and a proxy cell share one baseline. Nothing is written to the gateway while a cell's load runs, and the tests check that it is not.
Reading the figures
A run's page shows each cell's steady window, from the end of the warm-up to the end of the last stage:
| Figure | What it is |
|---|---|
| Calls a second | The mean over the steady window |
| First byte, whole call | Latency percentiles as the agents saw them |
| Gateway | The gateway's own delay (x-gw-delay-ms, up to the response head); n/a where the target sends none |
| Overhead | The cell's latency minus its baseline's: what the target added, including what the gateway's own figure leaves out, such as relaying a stream |
| Flags | An agent in the gateway's stack, short of CPU or late; other traffic at the gateway; a configuration change during the cell; timeouts; a short steady window |
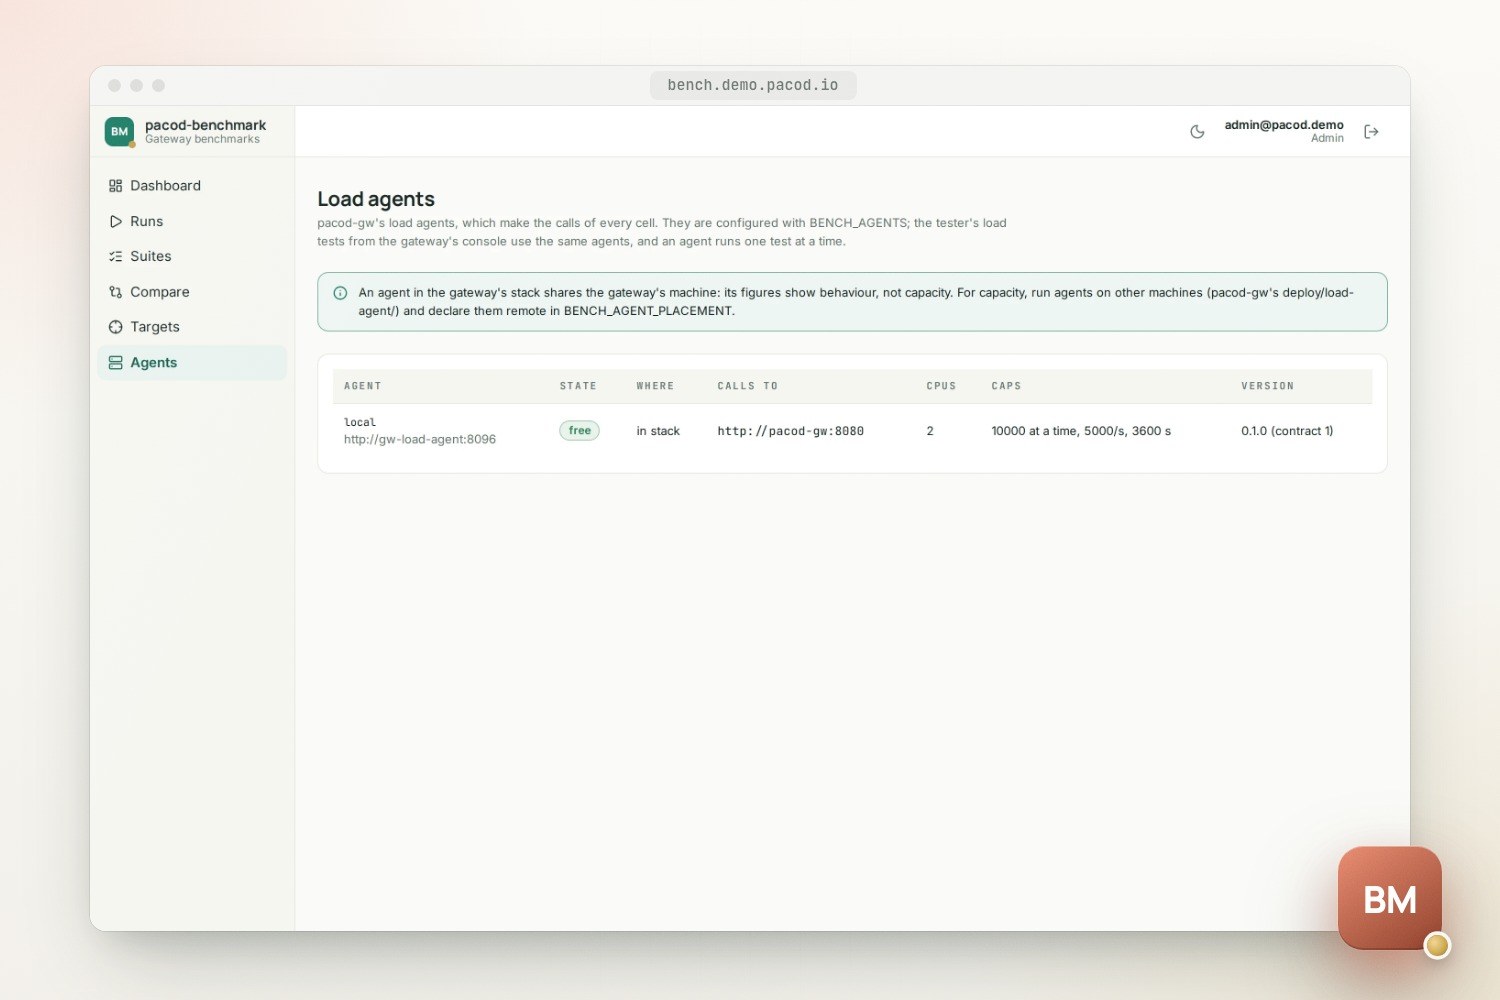
An agent on the gateway's machine takes CPU from the gateway, and Docker's network adds time. A run therefore counts as capacity only when every agent is declared remote, none ran short of CPU or late, no other traffic reached the gateway, and the target declares its mock as its own. Otherwise it is behaviour, and the run's page and its report say so, with the reasons. In pacod-demo the agent shares the gateway's machine and the mock also serves the tester's load tests, so every run on the demo gateway shows behaviour.
A cell's comparison key is the SHA-256 of its whole configuration as canonical JSON. Cells with the same key ran the same configuration, in any run and on any target. Run again on a finished run queues its own copy of the suite on the same target with the same agents, so its cells have the same keys as the first run's.
Targets and agents
| Target | What the benchmark does there | How it is added |
|---|---|---|
| A managed pacod-gw | Sets each run's scene up through the management API, with a platform-admin token | In the UI by an admin, with the token; or from the configuration (BENCH_GW_ADMIN_URL, BENCH_GW_TARGETS) |
| An external target | Nothing: it sends calls to a URL and a model, with a key pasted for each run | In the UI by an admin |
An external target lines up with a managed gateway only when it sits in front of the same mock with the same profile, which it declares. A target that may reach a paid provider needs a cap on calls in every cell and an acknowledgement of the cost at every run, and each call is made only once. A check of a target makes one call through it with a probe scene of its own, so that a mock outside the gateway's egress allow-list shows there, not later as a run full of errors.
The agents are pacod-gw's load agents, listed in BENCH_AGENTS or added by an admin in the UI. An
agent runs one test at a time, so the benchmark and the console's tester never load one agent at
once; a cell waits for a busy agent, then is skipped with a flag.
| Where the agent runs | How |
|---|---|
| In the benchmark's own stack | bench-load-agent |
| In a pacod-gw stack | Its gw-load-agent (docker-compose.load.yml) |
| On another machine | pacod-gw's deploy/load-agent/, aimed at the gateway's public data plane |
| On Kubernetes | pacod-gw's Helm chart, loadAgent.enabled |
Each agent is declared in_stack, same_host or remote, and only remote agents can make a
capacity run.
Reports
A finished run's report, pacod-bench-report/1, is built with pacod-gw's own crate and checked by
its own validation. It holds the target; the deployment's facts, each observed from the gateway or
declared by the operator; the agents and where they stood; behaviour or capacity, and why; and
every cell with its figures, histograms, seconds and flags. It holds no secret, and it names who
ran it, not who published it, so a download and a publication are the same report.
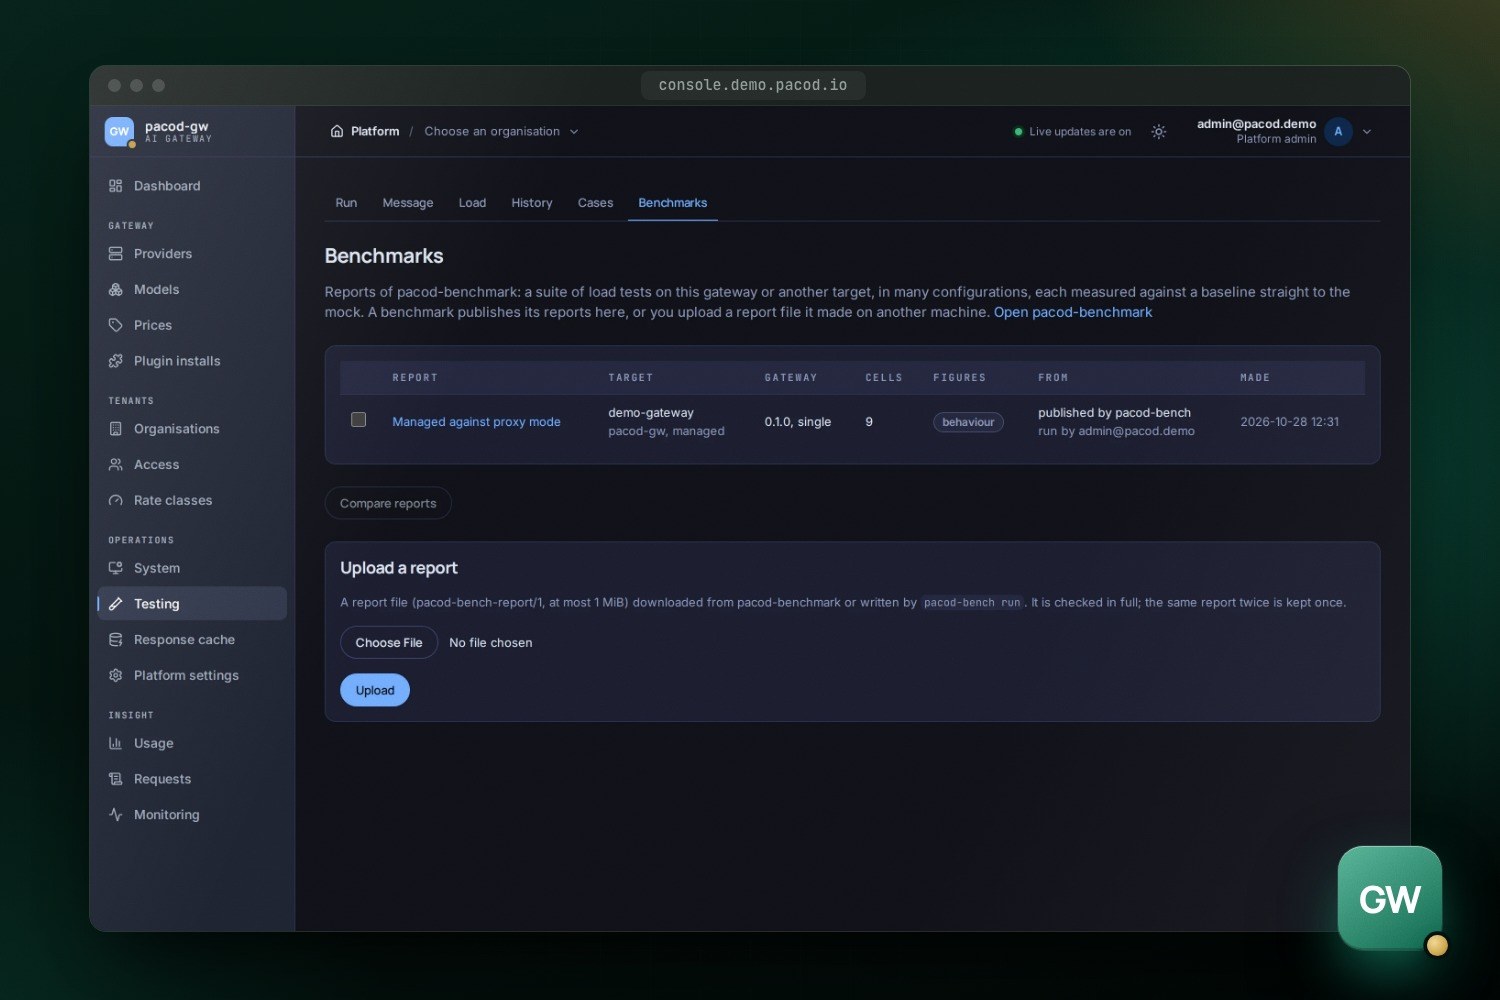
- Publish to pacod-gw sends it to the gateway's management API; it shows under Platform → Testing → Benchmarks.
- Download gives the same bytes, to upload in any pacod-gw console. The gateway keeps a report once per SHA-256, so the same report twice is one.
pacod-bench validate report.jsonchecks a file as the gateway does.
A report is at most 1 MiB: the seconds of long runs are thinned out, the figures and histograms never.
Roles and security
Roles are pacod-id's, defined in authz/bench.yaml and pushed to pacod-id at every start. No role
is implicit: an account without one sees "no access".
| Role | May |
|---|---|
bench.viewer |
Read agents, targets, suites, runs and results; download reports |
bench.operator |
And write suites, start and cancel runs, publish reports |
bench.admin |
And add gateways, external targets and agents, change the run settings, delete runs, clean up leftovers, give roles |
A run acts on a managed gateway with the benchmark's platform-admin token, not with the caller's rights, so the operator and admin roles are for people trusted with that. The threat model says what it costs and what limits it:
- An allow-list. The client of the management API has one method for each call a run makes, and no generic one. It deletes only below the run's own scratch organisation, and writes providers and models only under the benchmark's mock names.
- Sealed tokens. The token of a gateway added in the UI is encrypted with a data key of its own
(AES-256-GCM), which is wrapped under
BENCH_KEK, a key kept in the environment or a file, never in the database. The target's id and management API are bound into the encryption, so a token copied to another target, or one whose address was changed in the database, does not open. No answer, run, report or log carries it. - Out of reach. The API listens on
pacod-admin-netalone and is never published by Caddy. The gateway's audit log names the benchmark for every change it makes. - Keys. A pasted key of an external target stays in memory and is never written. Each cell's scratch key allows only that cell's mode and model.
- Agents. An agent compares the token in constant time, and the token is at least 32 characters. The API speaks plain HTTP to the agents, so agents on other machines need a private network or a VPN.
- Schedules fire with their creator's authority: at every fire the benchmark checks that the creator may still start runs, and switches the schedule off if not.
The UI signs in as a confidential client of pacod-id with PKCE. The API takes only tokens issued for its own audience, and refuses them when its copy of the roles is more than a minute old.
Deployment and operations
| Service | What |
|---|---|
bench-api |
pacod-bench serve: the API, the run queue and the scheduler; metrics on port 9190 |
bench-ui |
The UI, behind Caddy |
bench-load-agent, bench-load-mock |
Standalone stack only: pacod-gw's load agent and mock provider |
bench-gw-lite |
Profile dev-gateway: pacod-gw-lite in front of the mock, to register as an external target |
docker-compose.yml holds the benchmark's own services; docker-compose.standalone.yml adds its
copies of the shared components (PostgreSQL, pacod-id, Caddy, Prometheus) and an agent and a mock of
its own. On a laptop, make dev-up starts the stack at http://localhost:18380 (sign in as
admin@pacod-bench.test, password pacod-bench-dev), aimed at a pacod-gw development stack on the
same machine. The benchmark manages that gateway once it has one of its platform-admin tokens,
added in the UI or in .env.
pacod-demo loads only the first file, next to the other products, and points it at the demo gateway, the gateway's load agent and its mock; it serves the UI at bench.demo.pacod.io. A Helm chart of its own is planned.
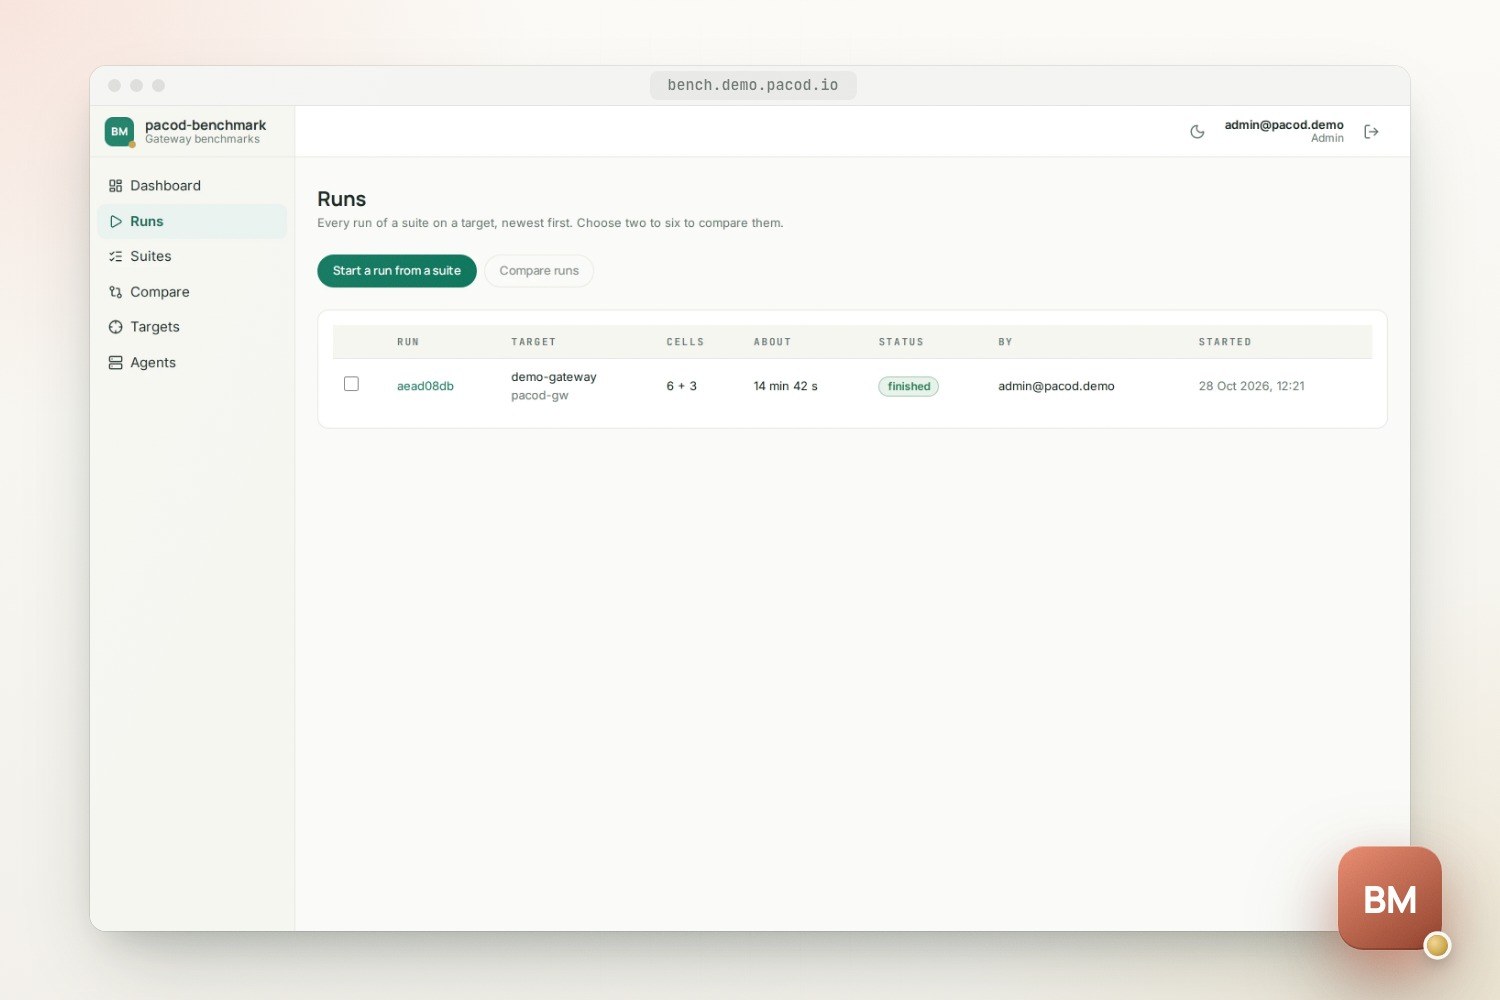
One run goes at a time; the others wait in a queue that the Runs page reorders. Schedules start a suite on a managed gateway in UTC, daily at a time on chosen weekdays or every few hours. A fire is skipped while the schedule's previous run still waits or goes, and a fire missed by more than 15 minutes is not made up for. An admin's settings can lower the limits of a run (cells, seconds, the wait for a busy agent) below the environment's, which default to 256 cells and four hours.
Every service logs one event per line to stdout, as JSON or text. The
runbook covers the
configuration, the gateway's token, targets, agents, rotating BENCH_KEK, and troubleshooting.
The command line
pacod-bench run runs a suite from a terminal and writes its report. The target file names where
the secrets are, never the secrets:
name = "lite on the laptop"
product = "pacod_gw_lite"          # pacod_gw, pacod_gw_lite, third_party
[external]
base_url = "http://127.0.0.1:18381"
model = "openai/gpt-mock"
key_env = "BENCH_TARGET_KEY"
paid = false
mock = { family = "openai", delay_ms = 200, chunk_delay_ms = 20, chunks = 20 }
[declared]
layout = "lite"
arch = "arm64"
A managed gateway takes [managed] instead, with its management API, the variable holding its
token and the mock as it reaches it. Ctrl-C cancels, and the scene is taken down first.
scripts/build-binaries.sh builds the command line as a native binary for Linux (static) and
macOS.
What has been tested, and its limits
- The controller is tested against a fake of the management API and an agent in process: a managed run sets its scene up, measures and takes it down, writing nothing during a cell's load; an external run sets nothing up and keeps only a hint of the key; a busy agent stops a run before anything starts.
- The API is tested against PostgreSQL: a suite from the API to its end, a cancel during a run, a gateway added in the UI that never shows its token, a restart that takes down what an interrupted run left, the queue, the settings, agents added in the UI, and schedules that fire, publish and never make up for a missed fire.
- The contracts of the load agent and the report are tested against pacod-gw's own fixtures,
and
make vendor-checkrefuses a copy of pacod-gw that is not a commit's. - In pacod-demo every run on the demo gateway shows behaviour, not capacity: the agent runs in the gateway's stack on the same machine, and the mock is shared. Capacity figures need agents on other machines and a mock of their own.
- The token a run uses is a platform admin's: pacod-gw has no narrower role for it yet.
- A cache cell measures a hit, not a mix of hits and misses: every call of a cell sends the same body.
- There is no Helm chart of its own yet.
The architecture document shows how the code is laid out, from the plan to the report.
Quick start
The stack, next to a pacod-gw development stack
make dev-up
open http://localhost:18380
The command line, without Docker
make plan SUITE=examples/suites/modes.yaml
cargo run -p pacod-bench -- run --suite examples/suites/modes.yaml --target target.toml --agents local=http://127.0.0.1:18096 --out report.json
cargo run -p pacod-bench -- validate report.json
Works with
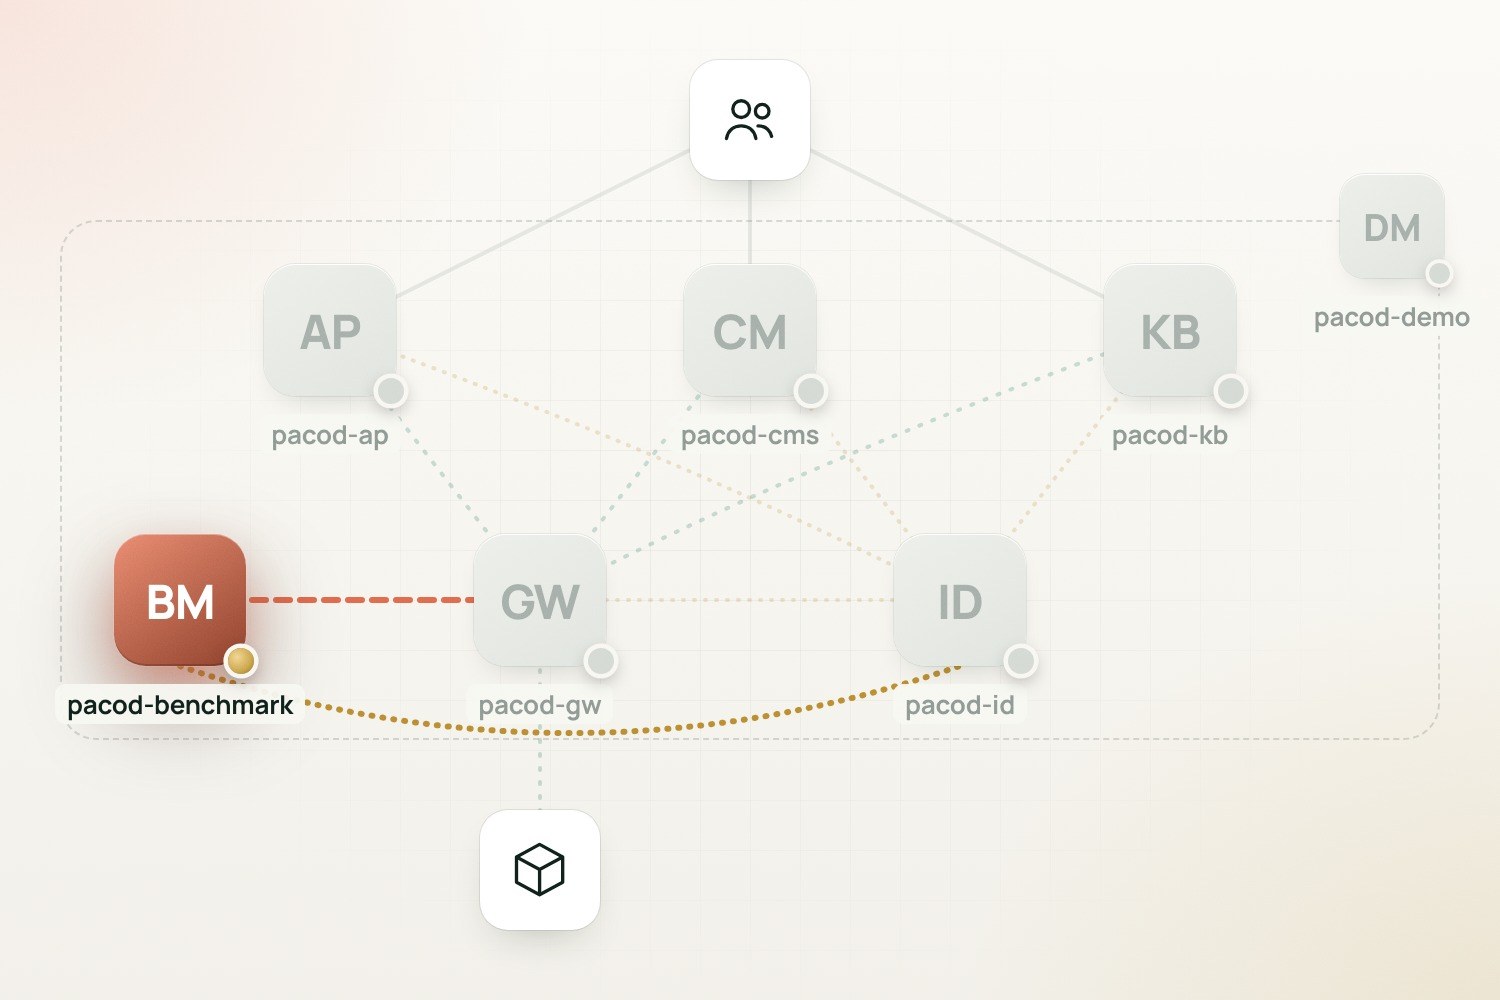
- pacod-gw: The gateway it measures. It drives pacod-gw's load agents and mock, sets each run's scene up through the management API, and publishes its reports under Platform → Testing → Benchmarks.
- pacod-id: People sign in to the UI through pacod-id, and the API checks every caller against the roles of authz/bench.yaml, which it pushes to pacod-id at every start.
- pacod-demo: Runs at bench.demo.pacod.io next to the other products, managing the demo gateway with a token the bootstrap mints, on the gateway's own load agent and mock.